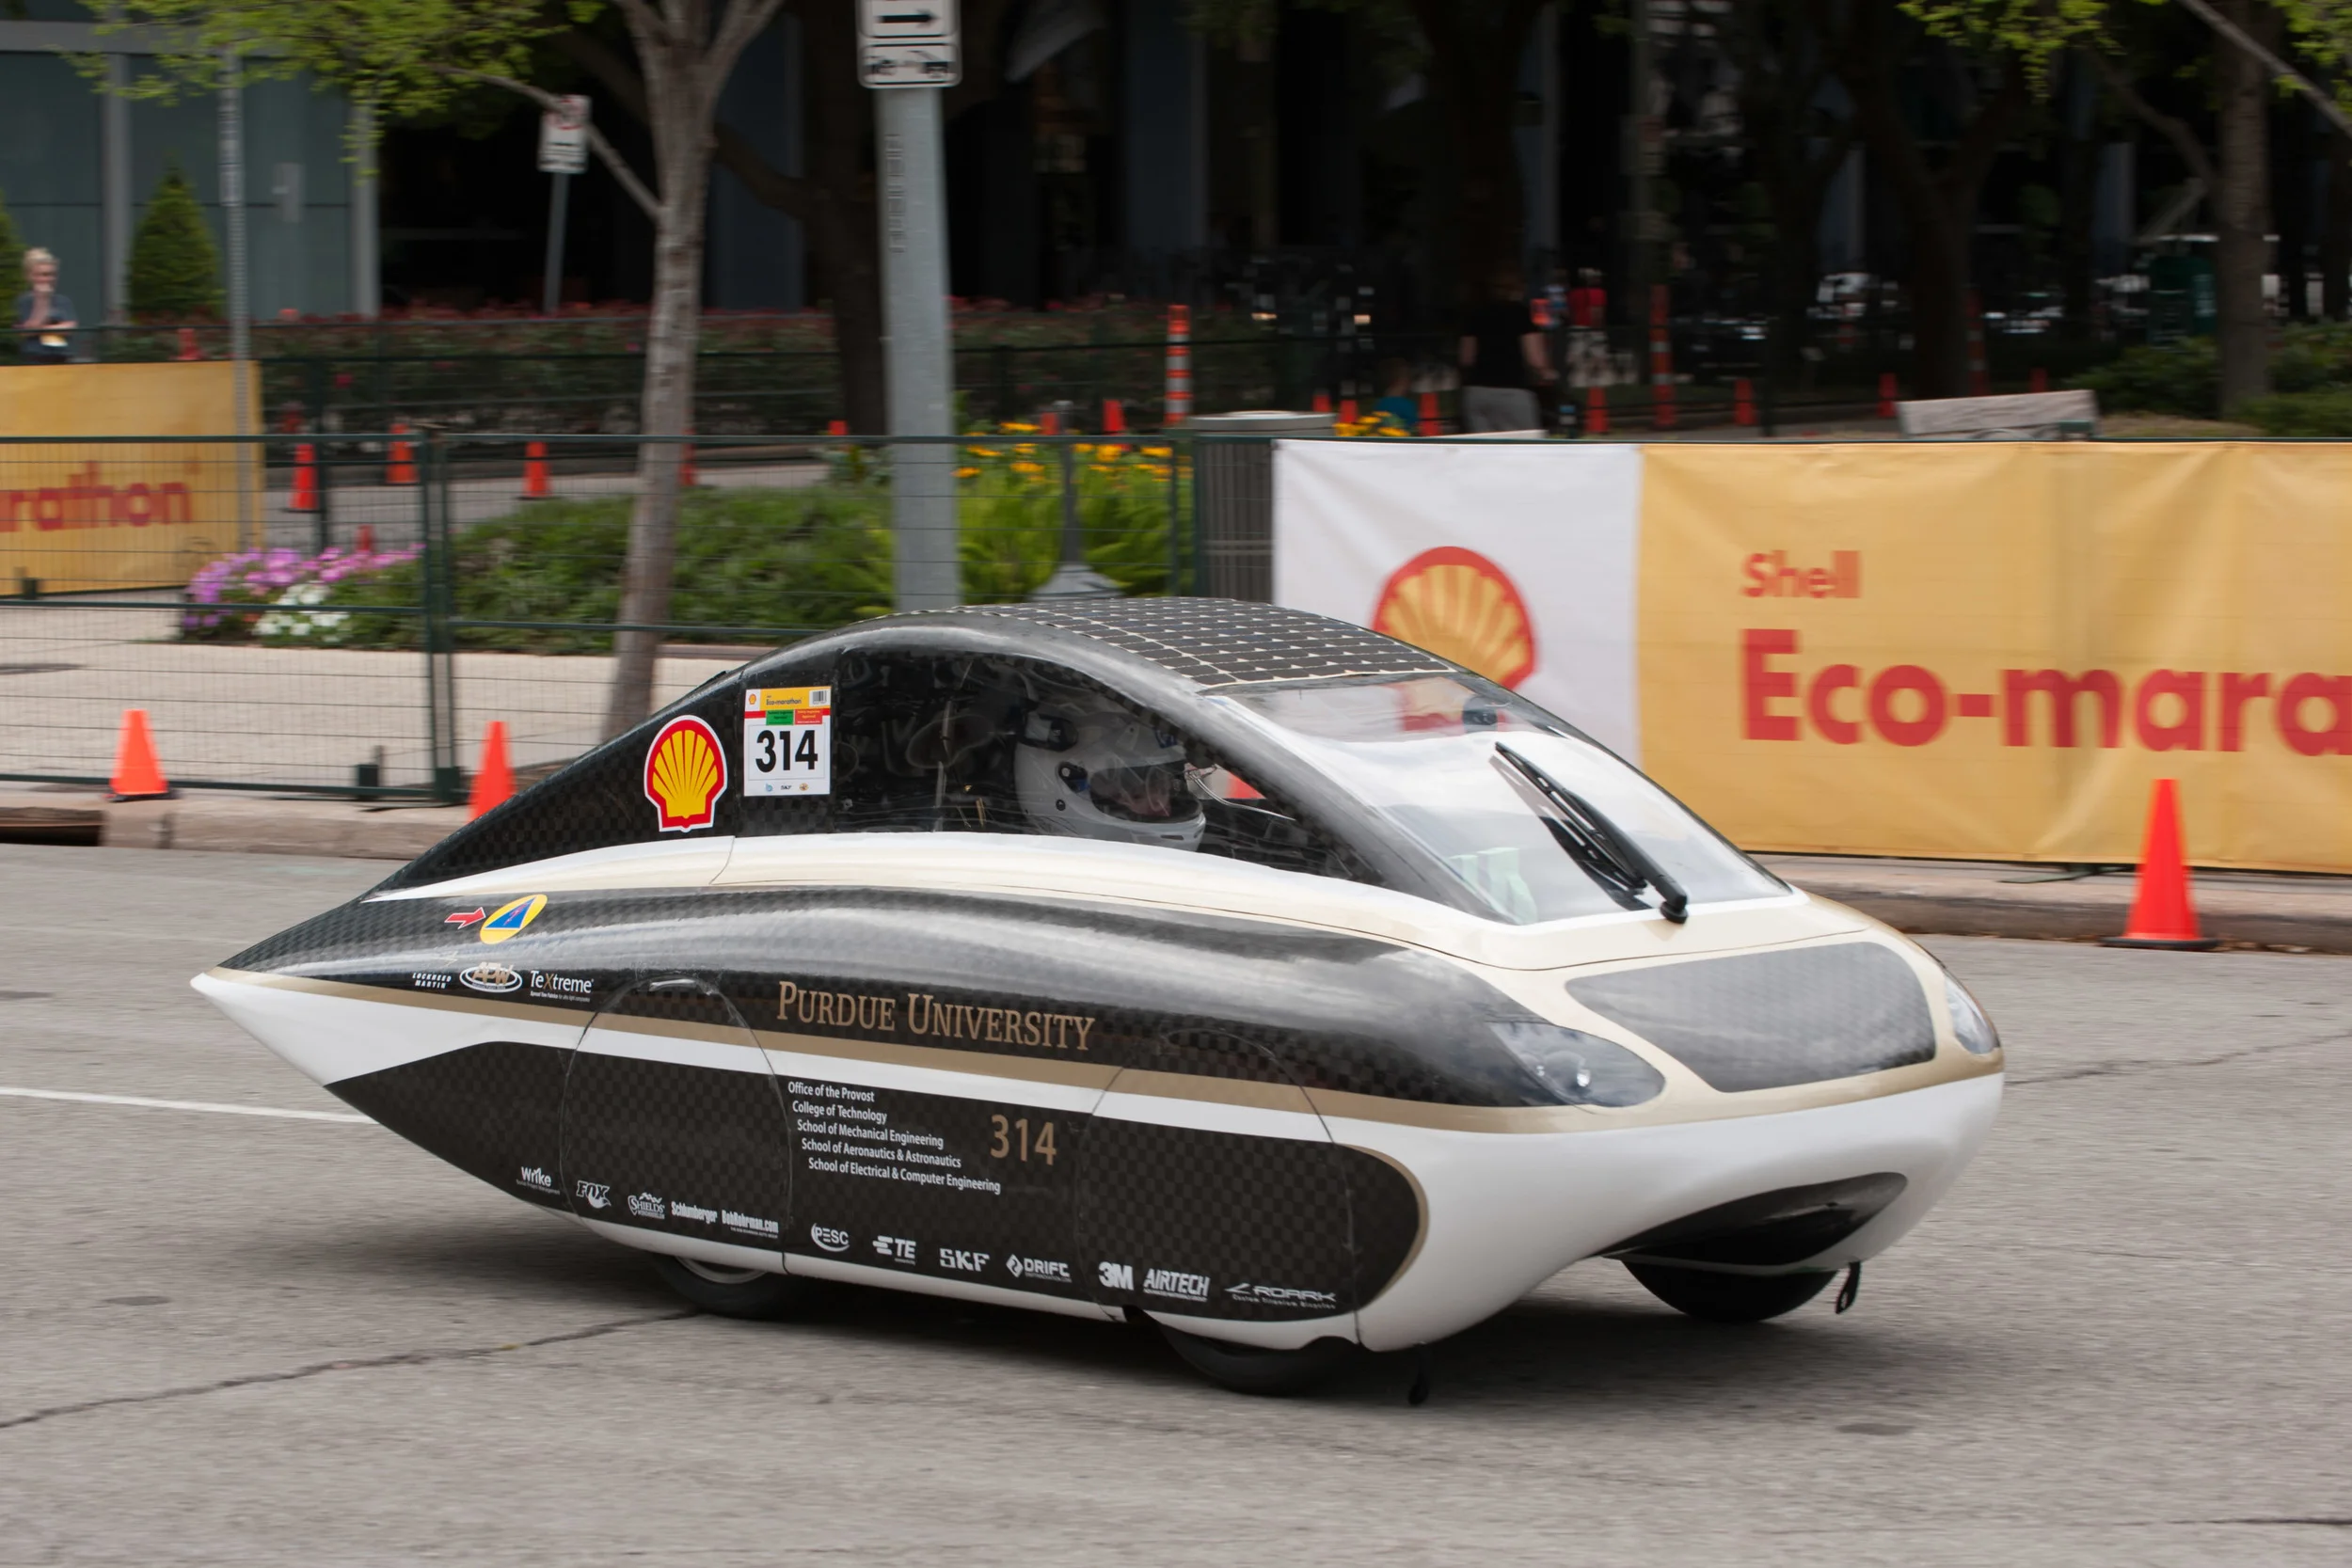
In Spring 2012, my Senior Design team at Purdue designed and built a touchscreen driver display used in Purdue Solar Racing's "Navitas" solar car, shown here in the 2013 Shell Eco-marathon.
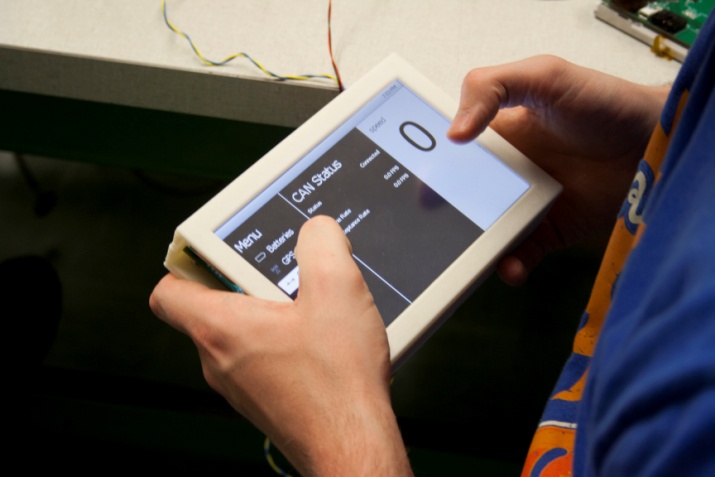
Close-up view of the driver display in our Senior Design lab shortly before installation in the solar car. In addition to my roles as team leader, I was responsible for designing the touch-sensing and graphics software libraries shown here, running on a hybrid configuration of PIC24 and PIC32 microcontrollers.
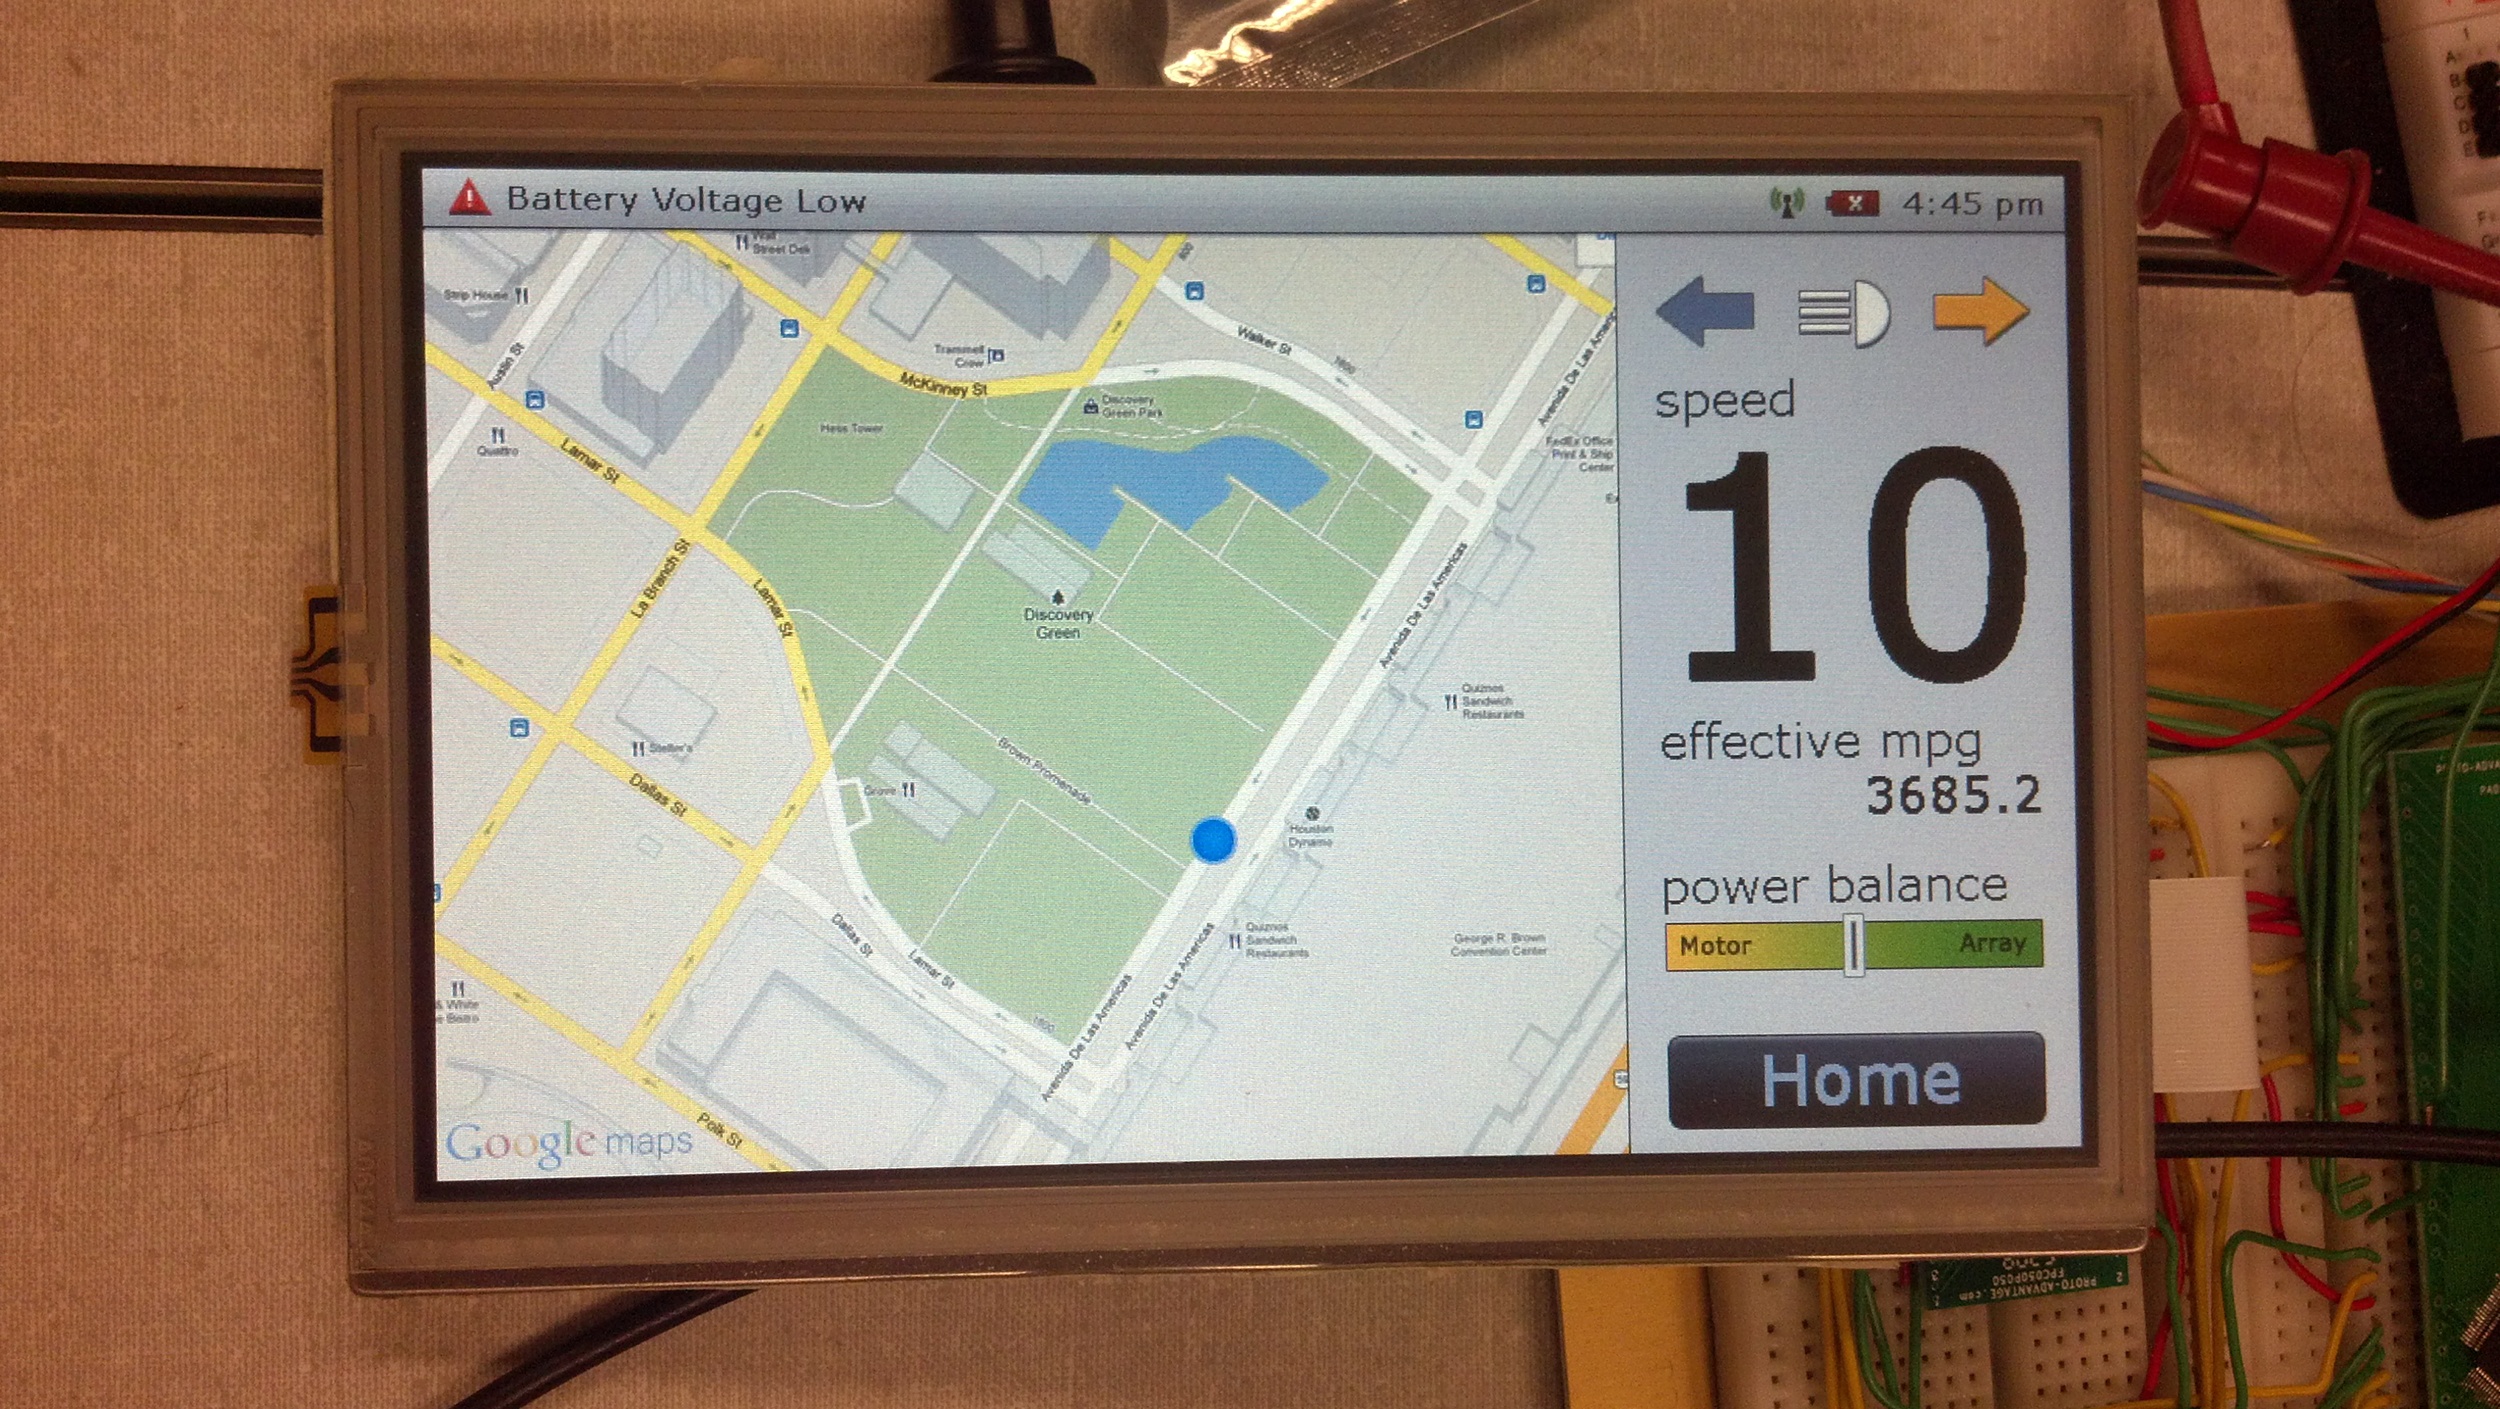
Early demonstration of some of the live metrics provided by the driver display. Because we were in a basement lab far from the solar car itself, theoretical data was assumed for speed, battery status, and GPS location. In the actual car, various vehicle sensors provide critical information via a CAN bus to this central system for use by the driver and automatic background monitoring.
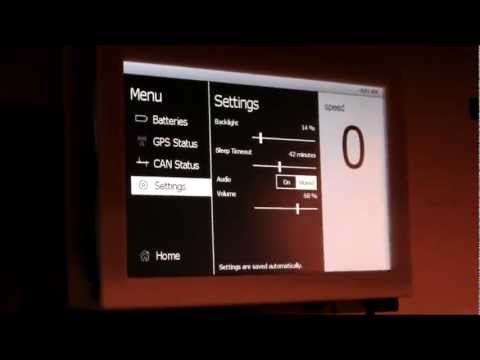
The driver display was tested in Purdue Solar Racing's then-current generation solar car Celeritas. This is the video for our Senior Design class demonstrating the five "Project Specific Success Criteria" (PSSC) that we set as goals for our project.